Data Visualization
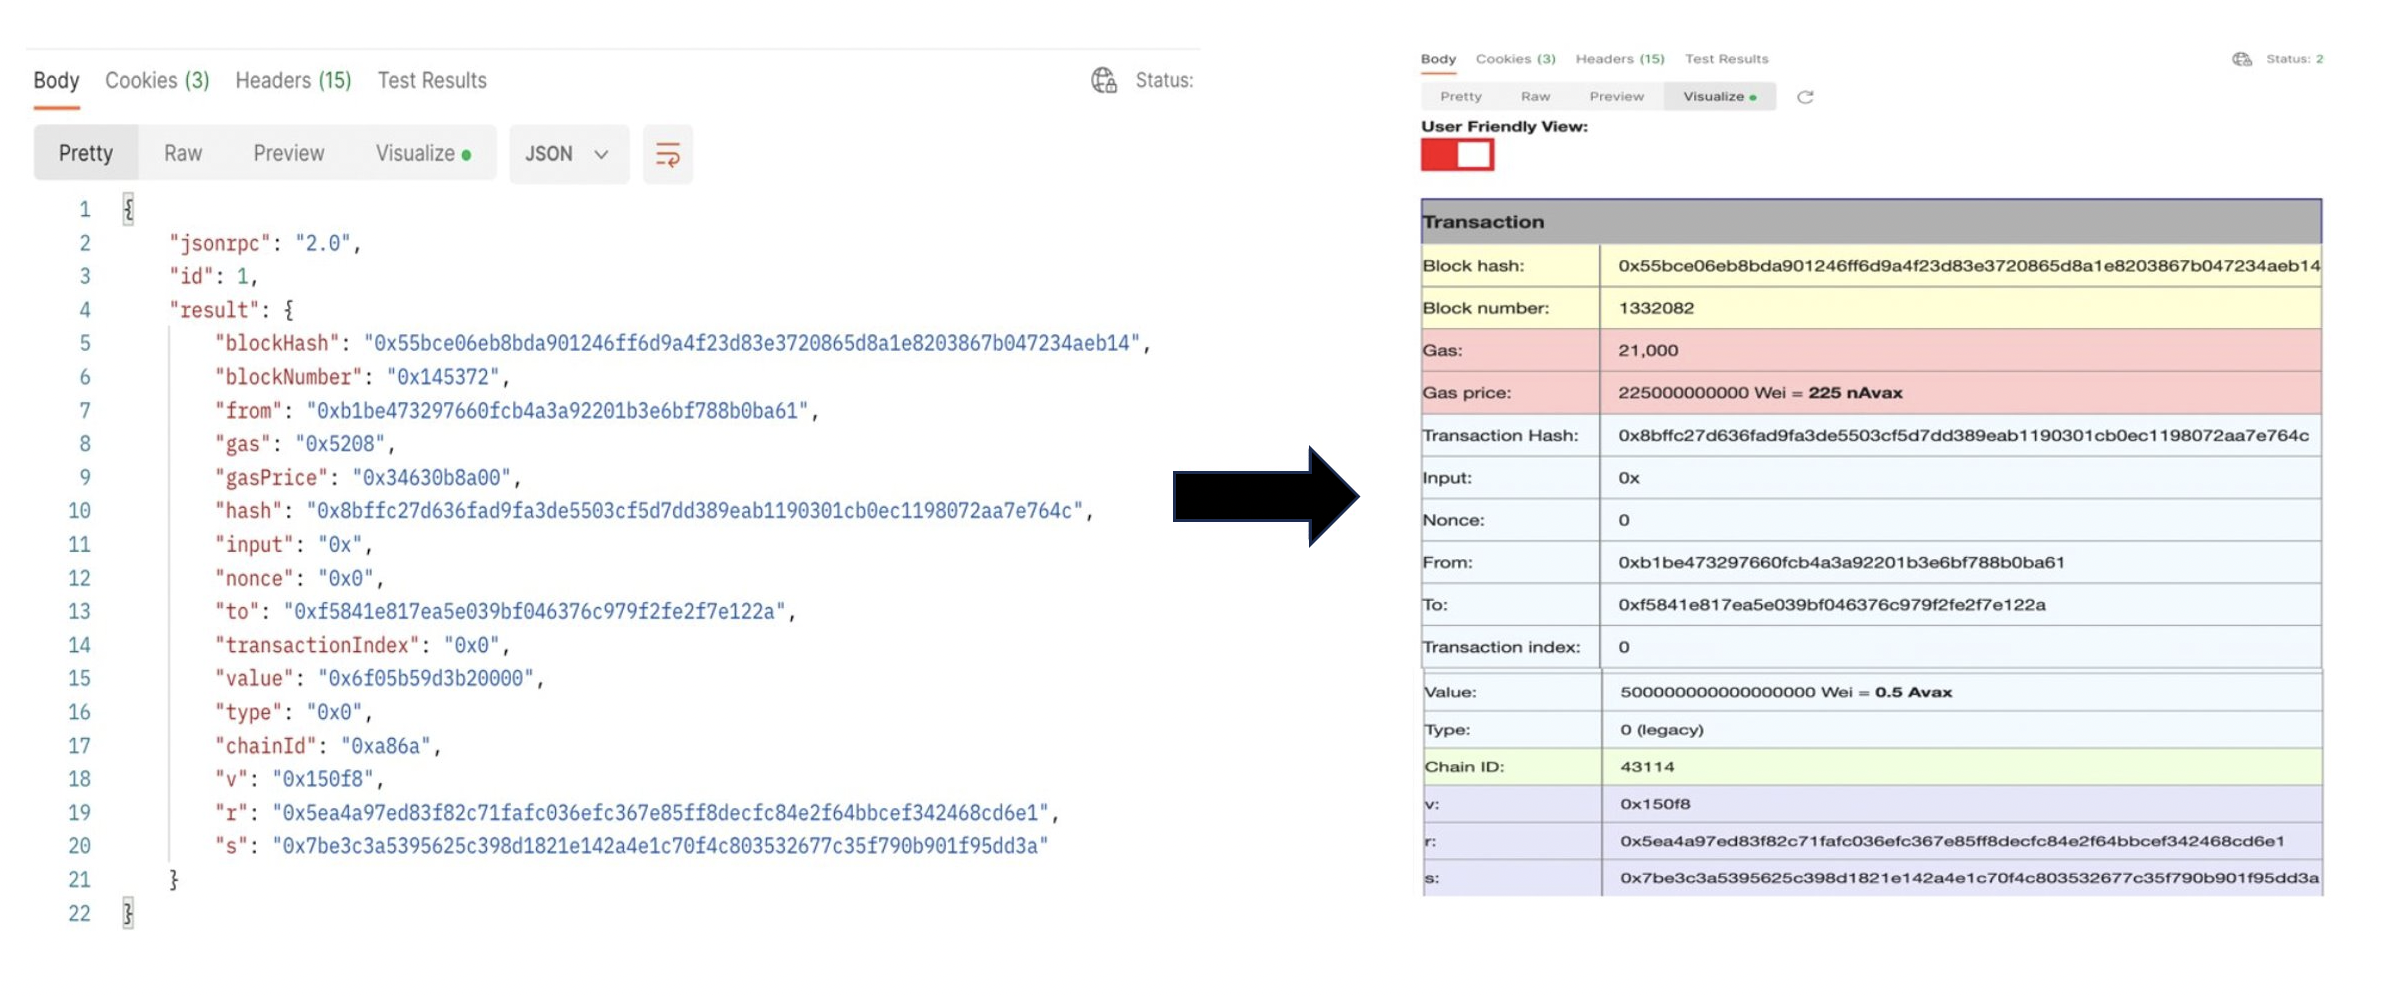
Data visualization is available for a number of API calls whose responses are transformed and presented in tabular format for easy reference.
Please check out Setting up Postman and Making API Calls beforehand, as this guide assumes that the user has already gone through these steps.
Data visualizations are available for following API calls:
C-Chain
eth_baseFeeeth_blockNumbereth_chainIdeth_getBalanceeth_getBlockByHasheth_getBlockByNumbereth_getTransactionByHasheth_getTransactionReceiptavax.getAtomicTx
P-Chain
X-Chain
Data Visualization Features
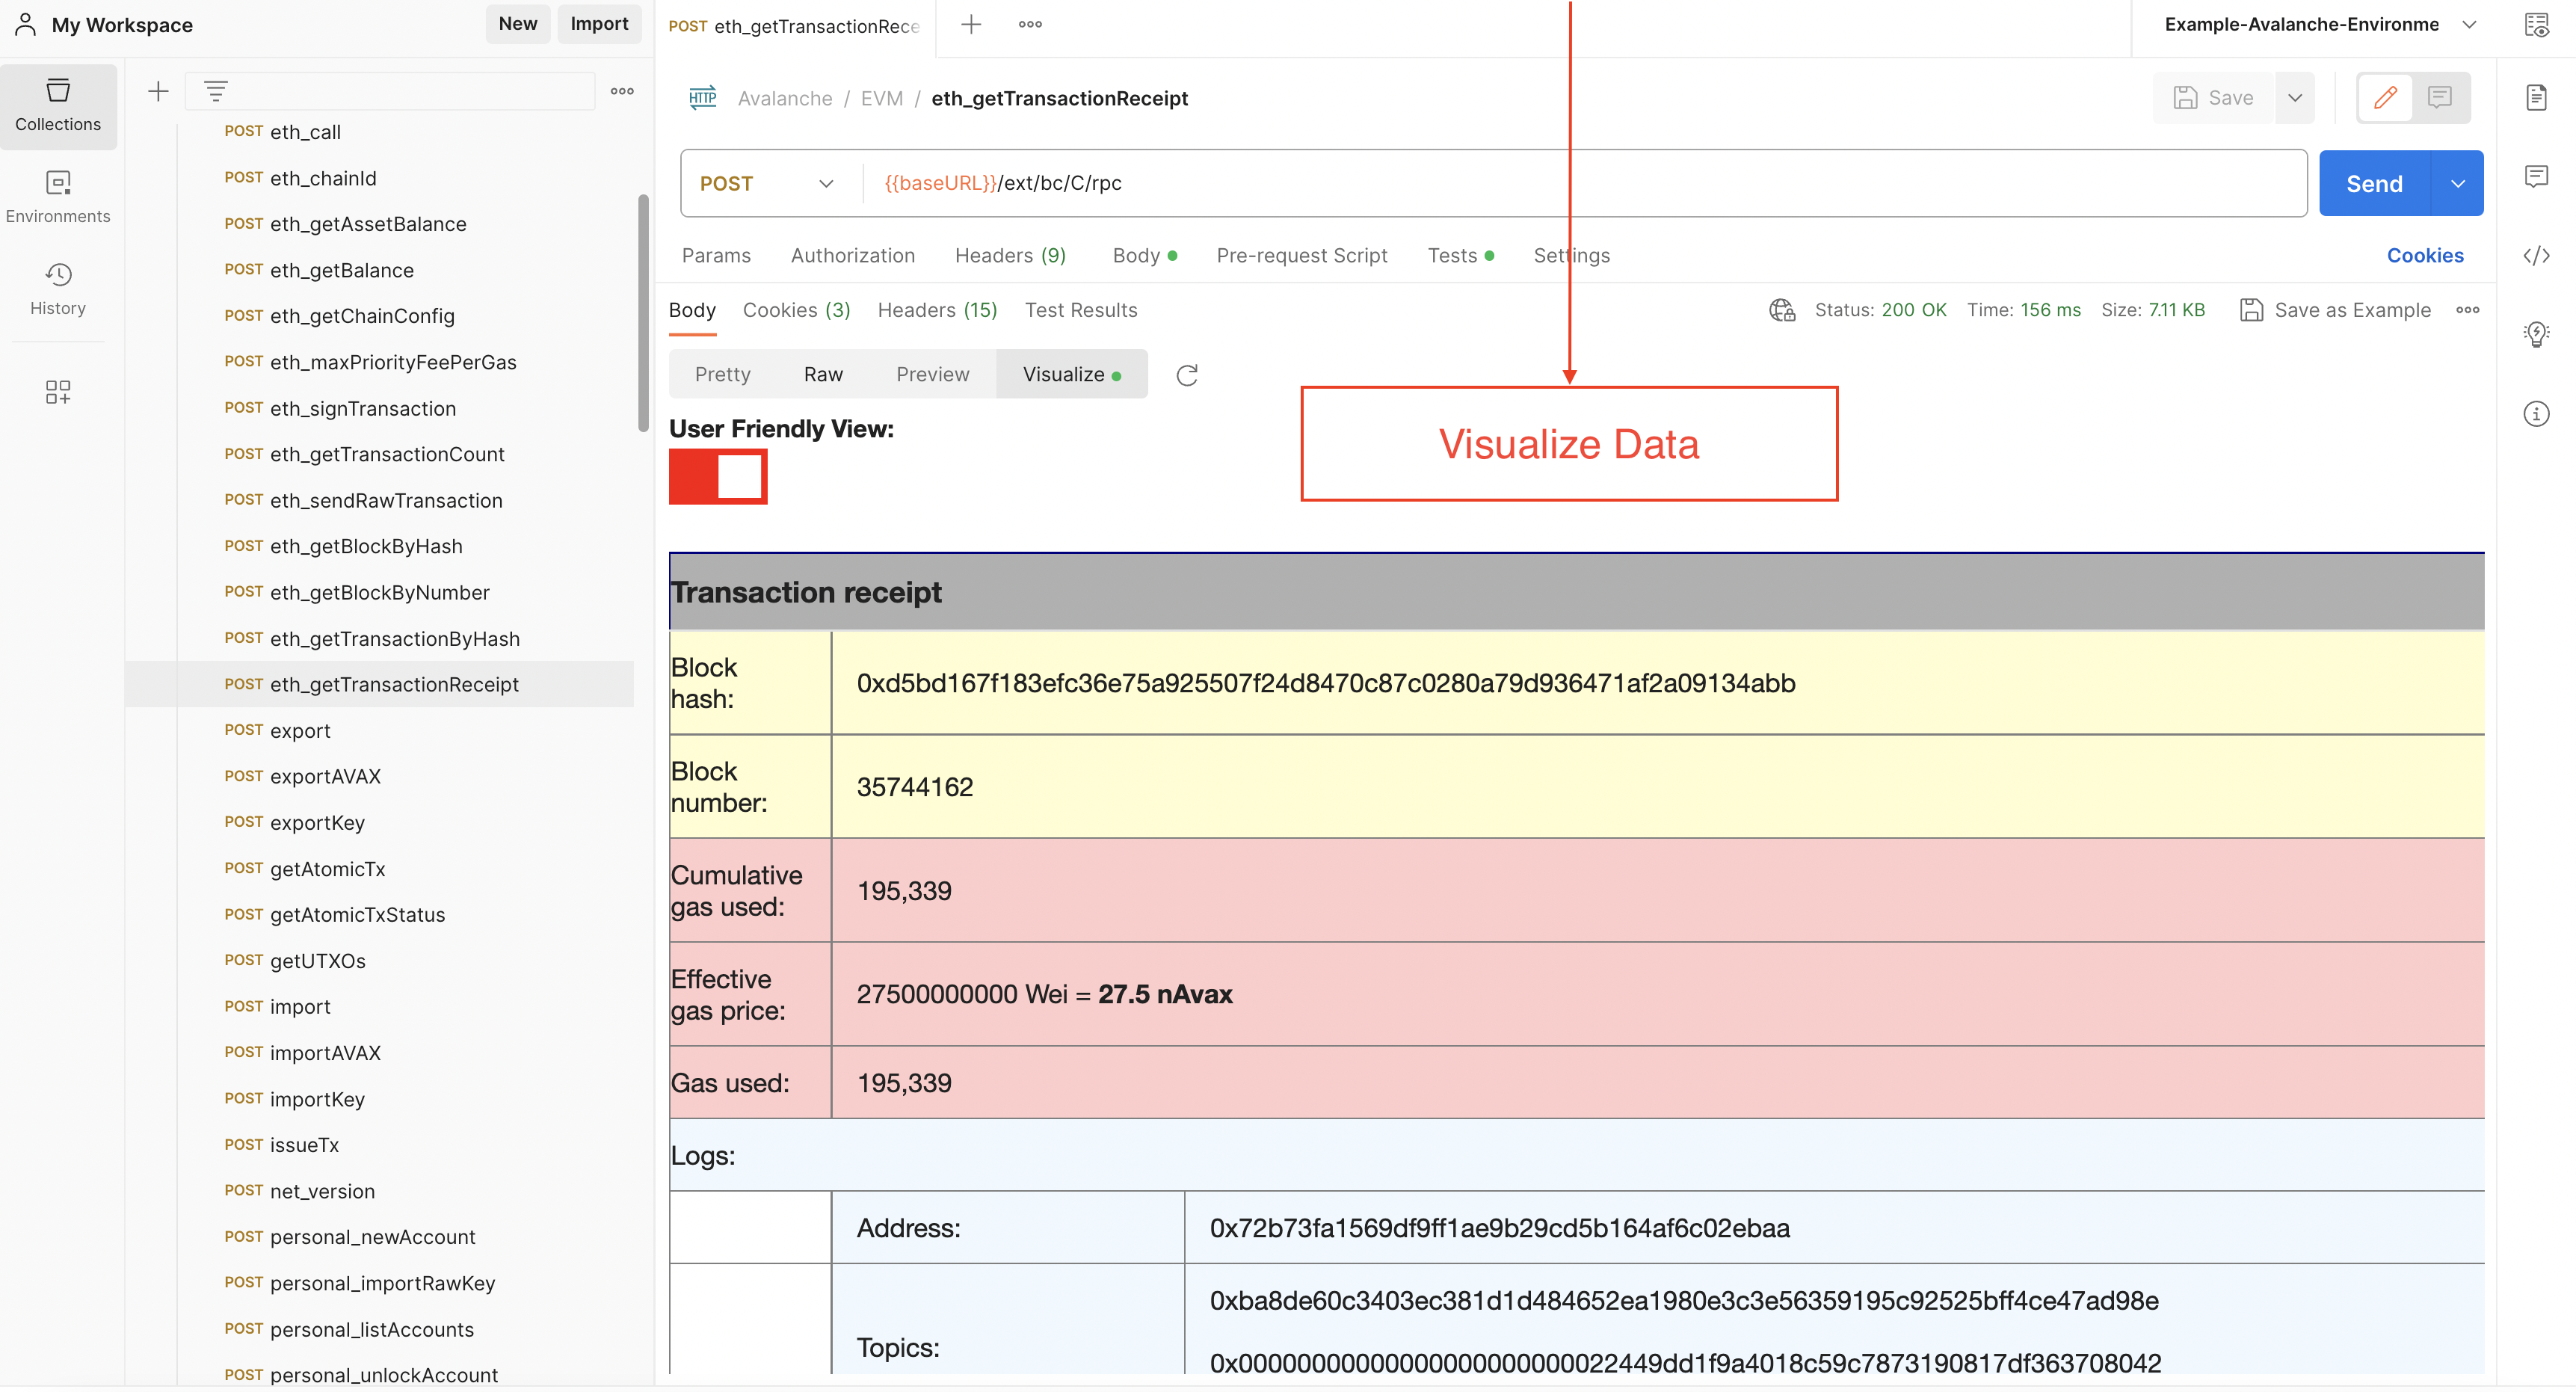
- The response output is displayed in tabular format, each data category having a different color.

- Unix timestamps are converted to date and time.

- Hexadecimal to decimal conversions.

- Native token amounts shown as AVAX and/or gwei and wei.

- The name of the transaction type added besides the transaction type ID.

- Percentages added for the amount of gas used. This percent represents what percentage of gas was used our of the
gasLimit.

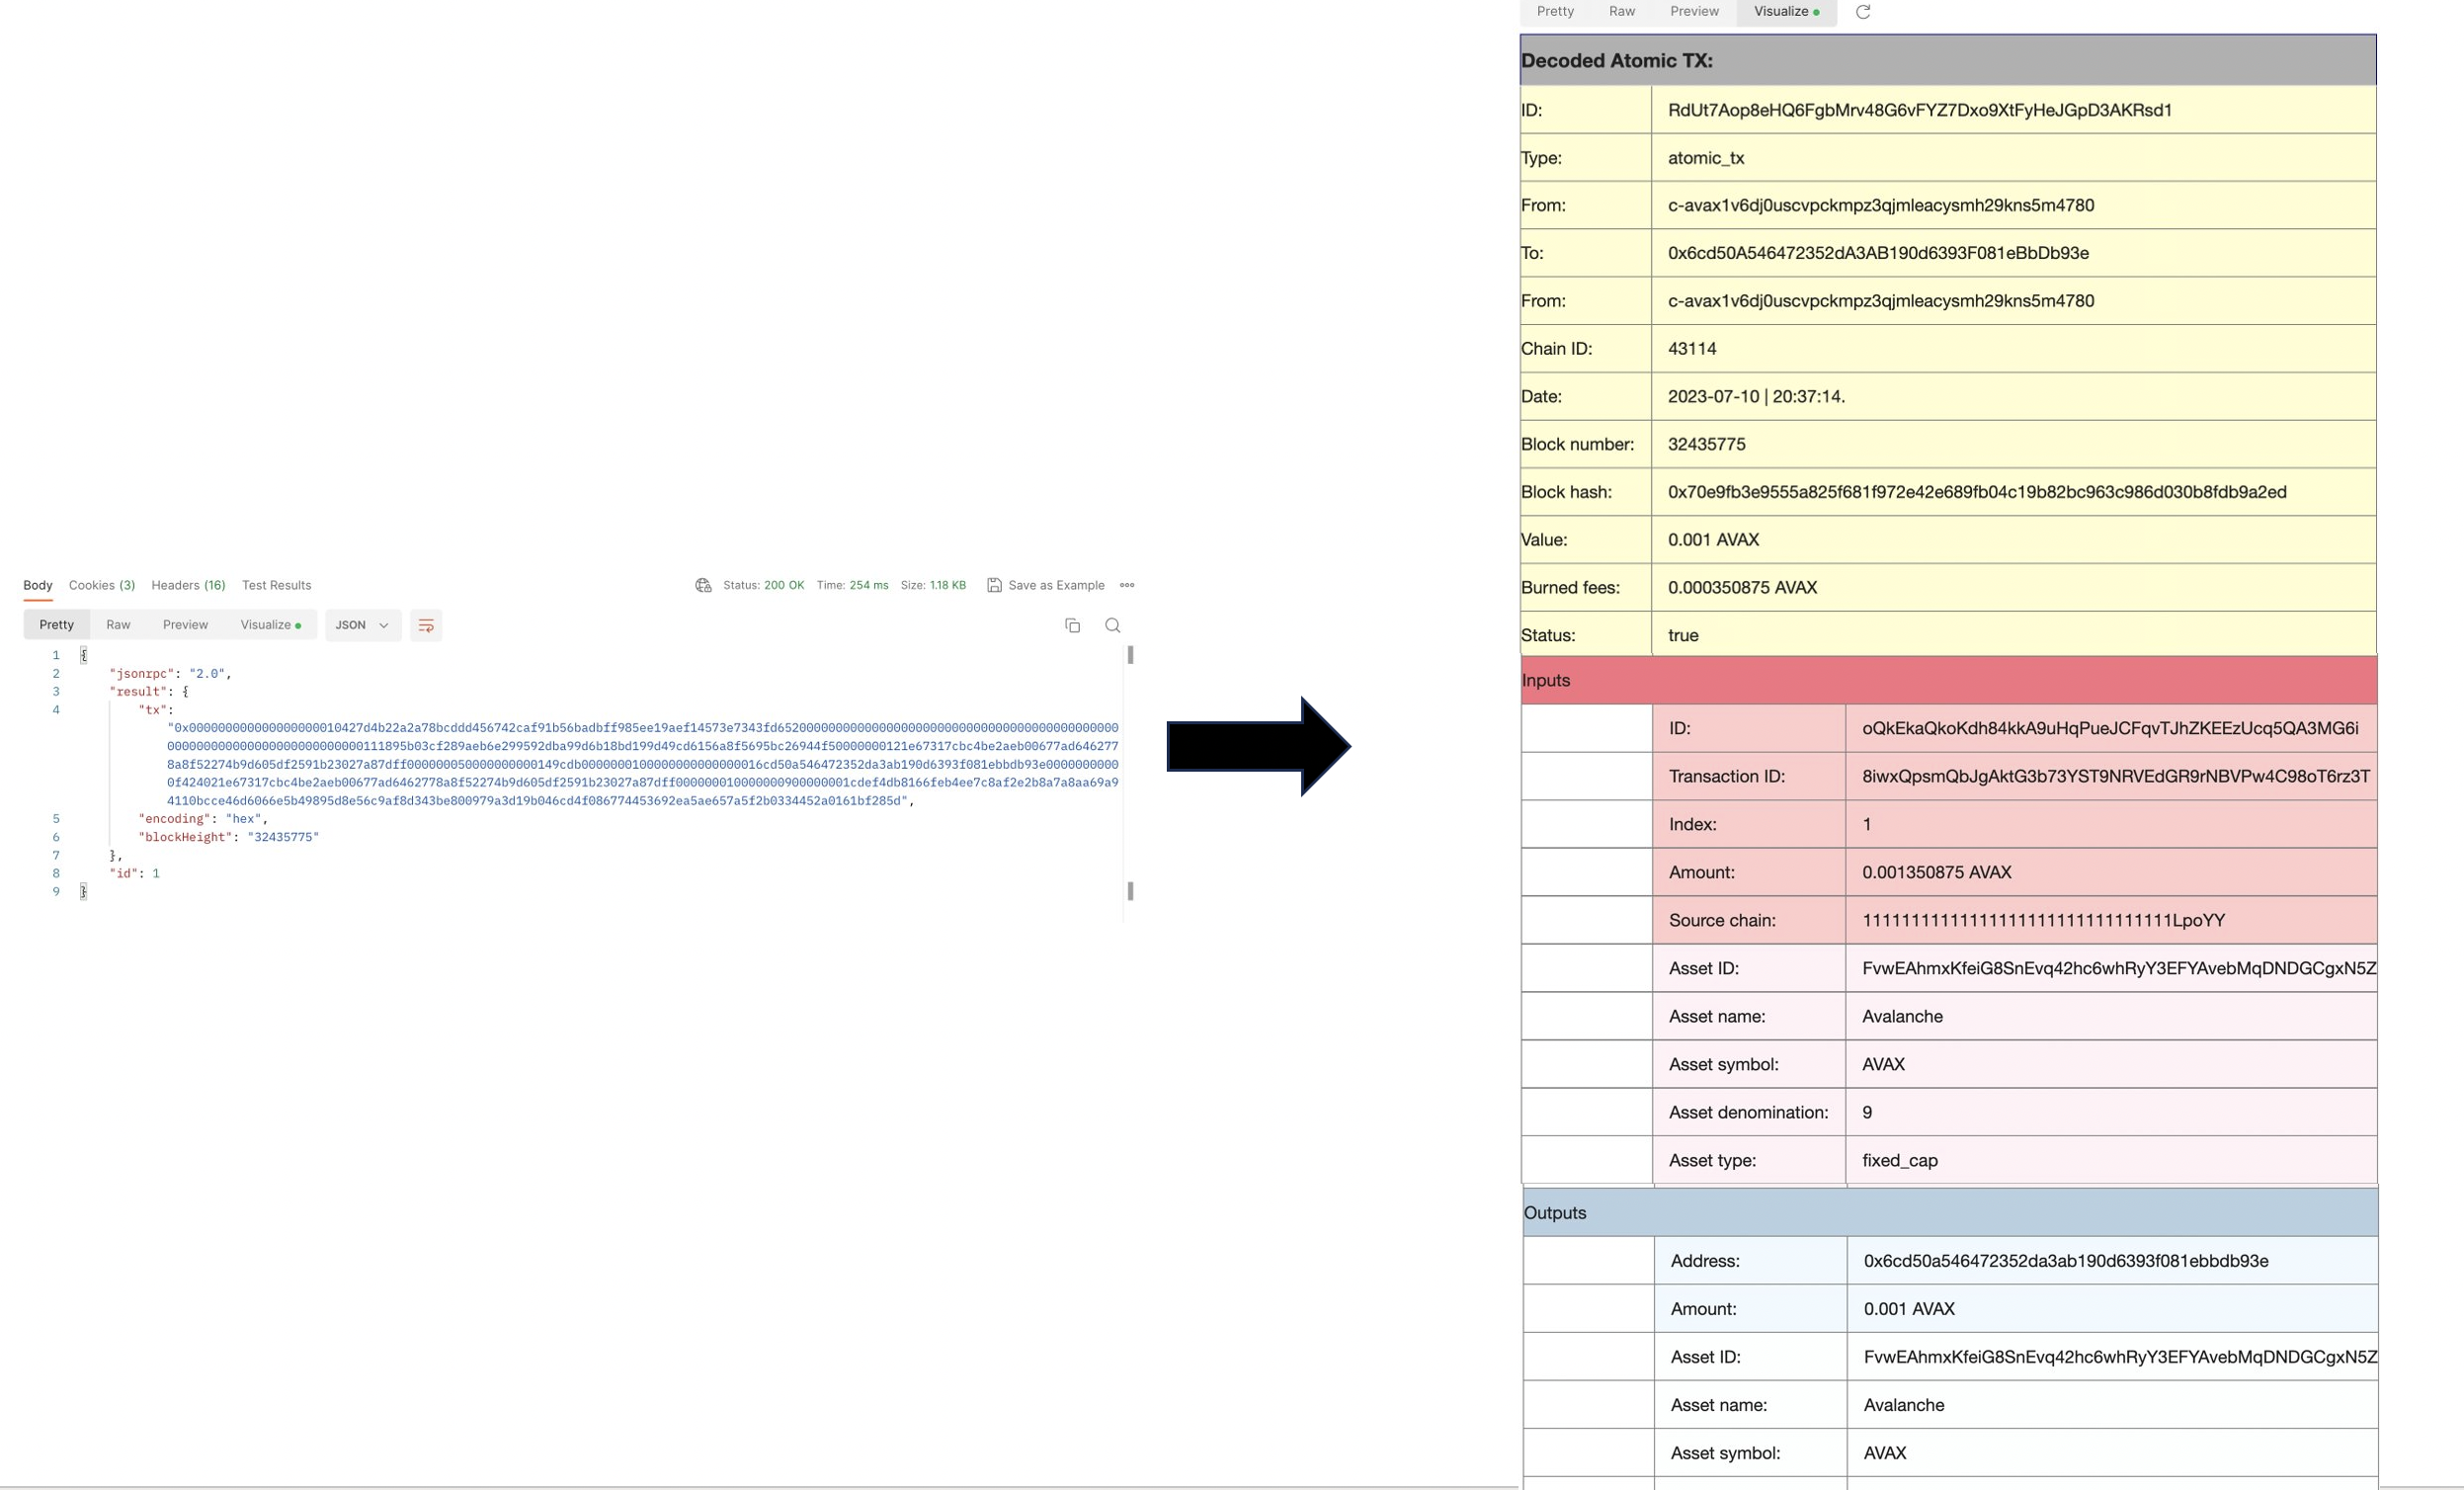
- Convert the output for atomic transactions from hexadecimal to user readable.
Note
Please note that this only works for C-Chain Mainnet, not Fuji.

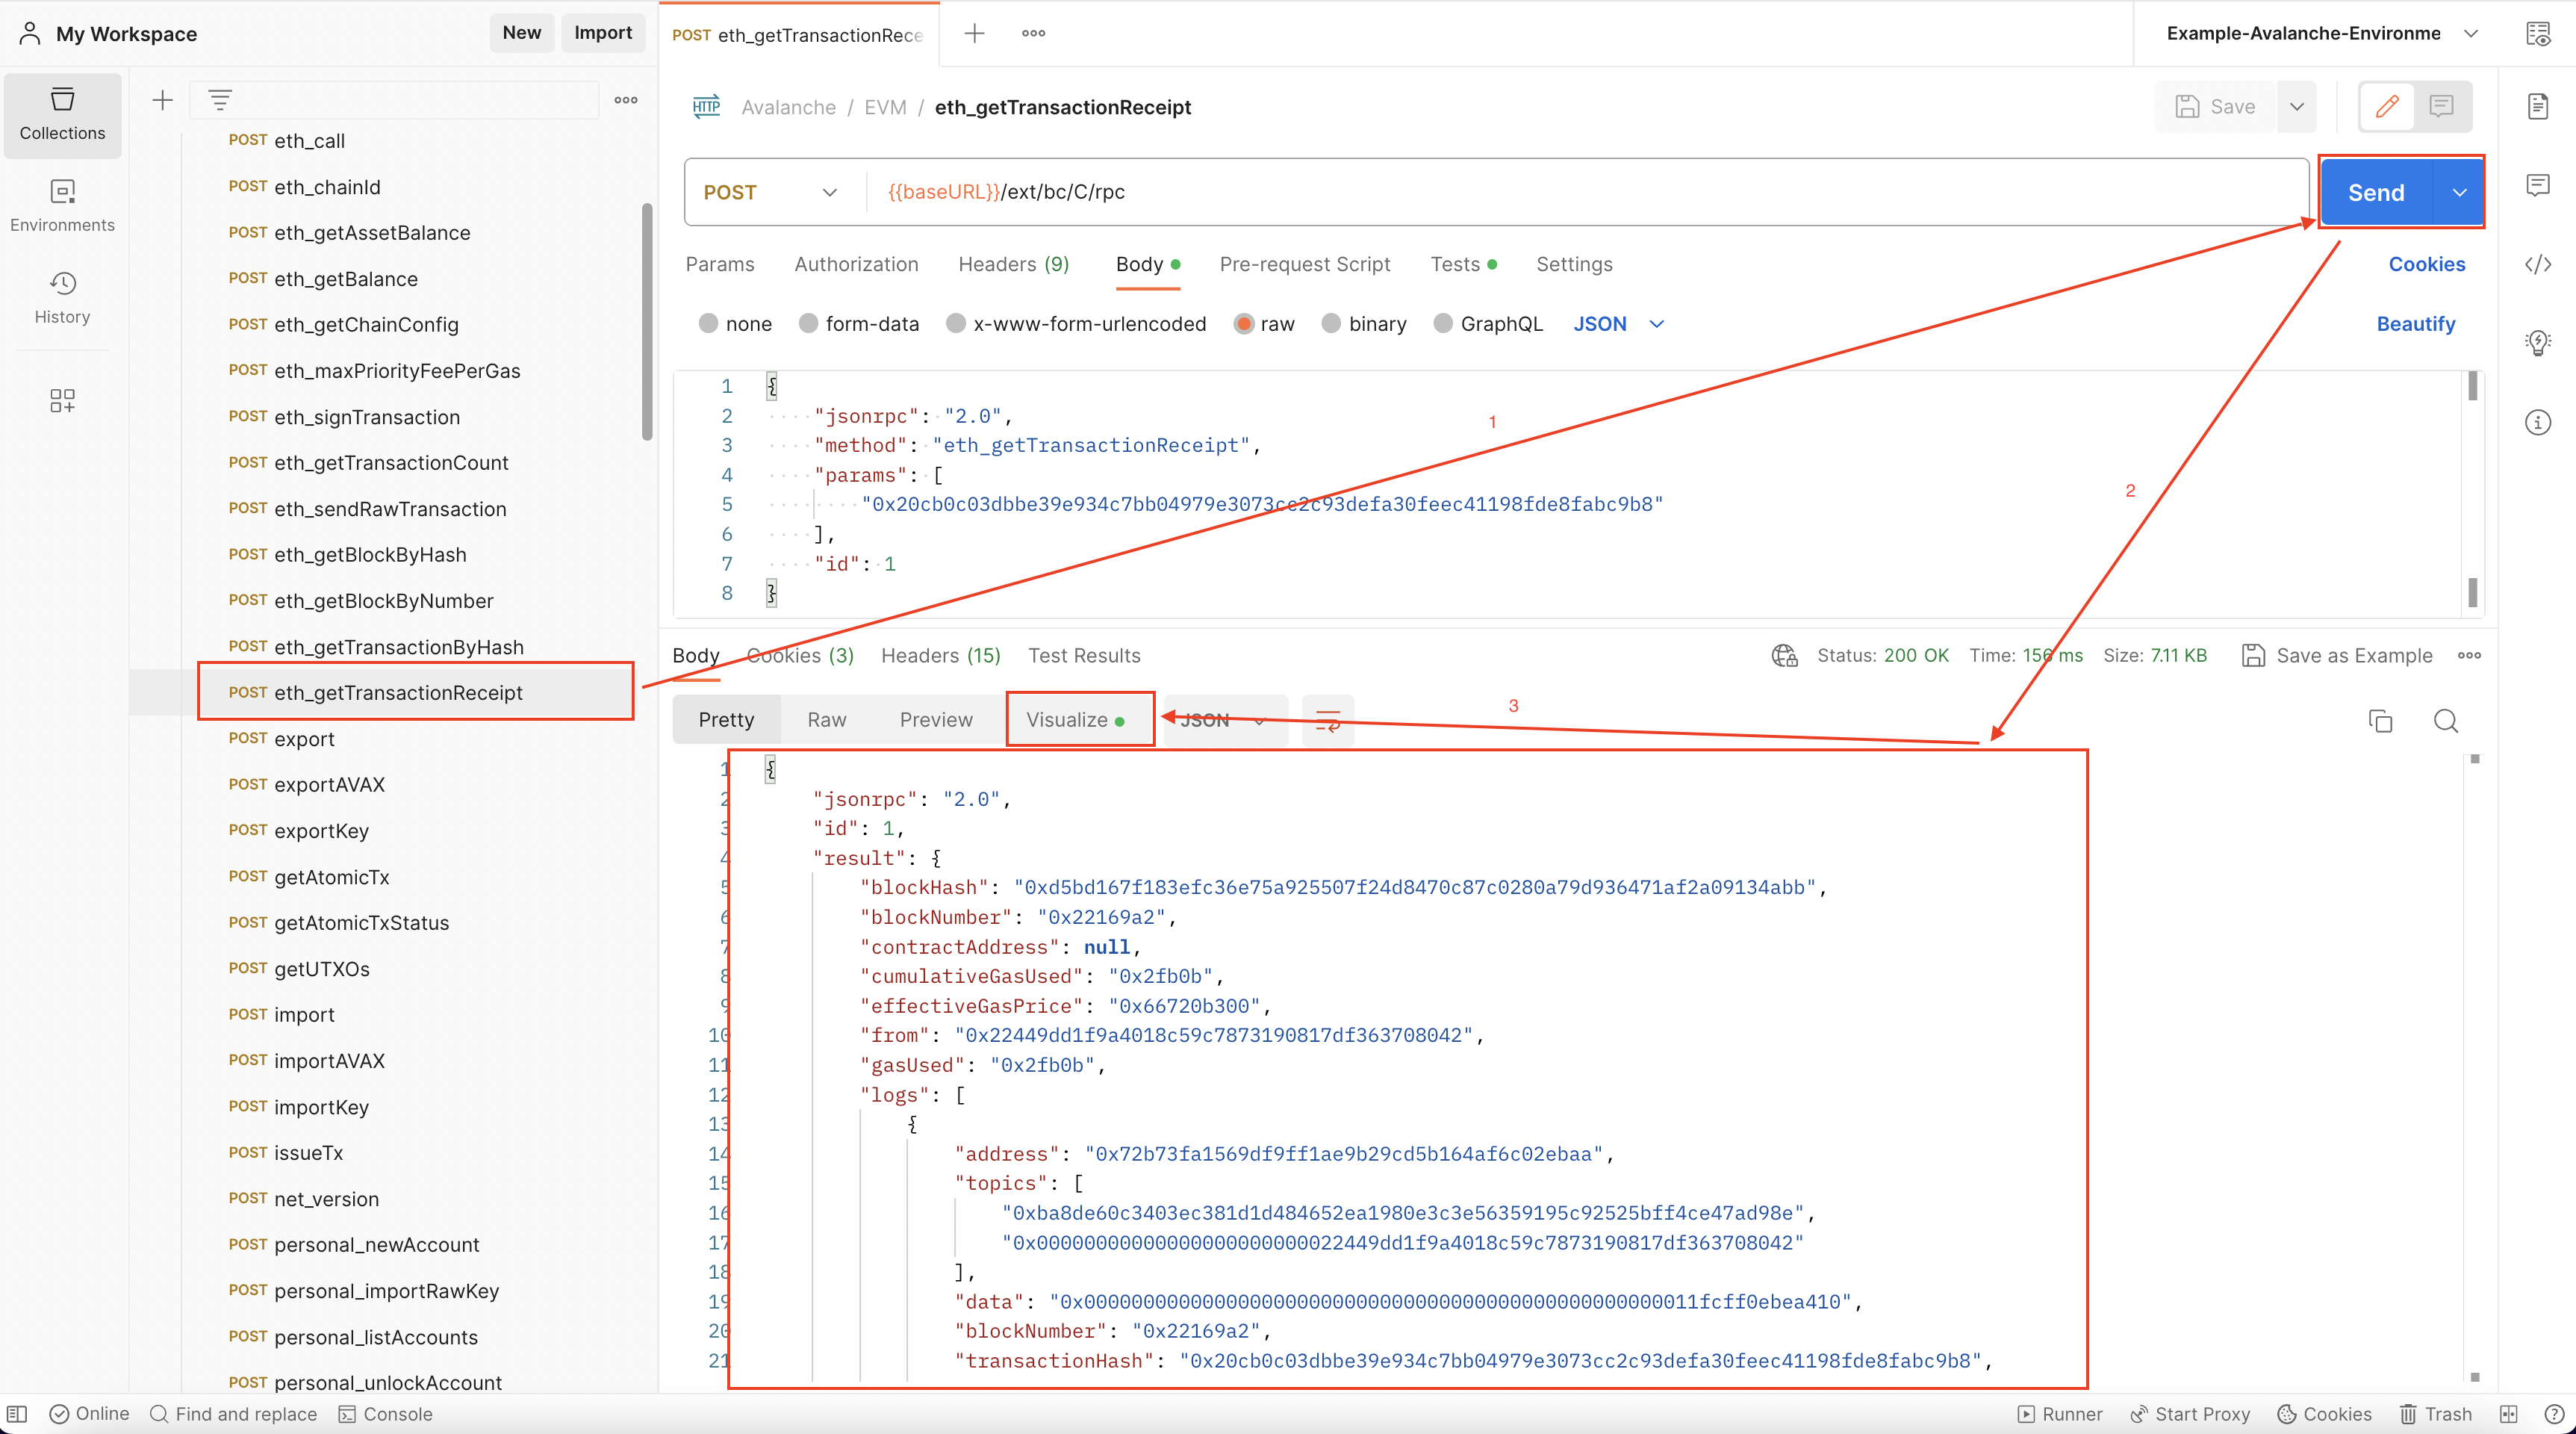
How to Visualize Responses
- After installing Postman and importing the Avalanche collection, choose an API to make the call.
- Make the call.
- Click on the Visualize tab.
- Now all data from the output is displayed in tabular format.


Examples
eth_getTransactionByHash
avm.getBlock
platform.getCurrentValidators
avax.getAtomicTx
eth_getBalance
Edit on GitHub
Last updated on